Pivot table data exploration tool
Most people are familiar with pivot tables as a quick, intuitive and flexible way to summarize and subdivide data. This easy yet powerful capability is available in Patchworks for summarizing data tables and producing reports.
Pivot tables are easy to use because they are based on a visual metaphor: drag fields from a list to column, row and data cell positions, and watch the table update instantly. Keep using the point and click interface until the summary appears exactly as you want.
Patchworks is well suited to using pivot tables because it exposes many of the internal data structures in a table format. Patchworks provides tables for the block attribute data (one record for each polygon), road networks (one record for each road segment), accounts (one record for each account) and more.
To carry out an ad-hoc query you can access the pivot table tool
from the standard Table Viewer.
Simply click on the pivot table icon to open a new pivot table.
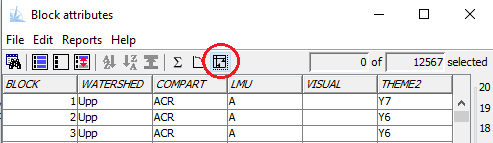
The pivot table tool will appear with a layout similar to the following:
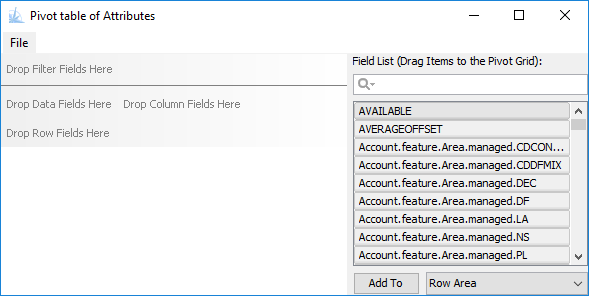
The "Field List" on the right side of the window contains all of the
fields defined in the parent table. Using the mouse, drag the desired
field to the Filter, Data, Row or Column drop location. As the fields
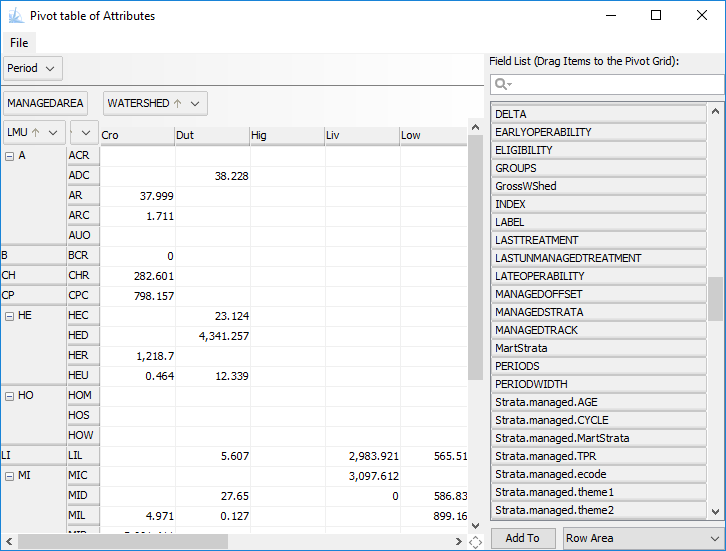
are moved the table will update automatically and populate the row, column
and cell values. Multiple fields can be added to each drop zone, resulting
nested rows or columns.
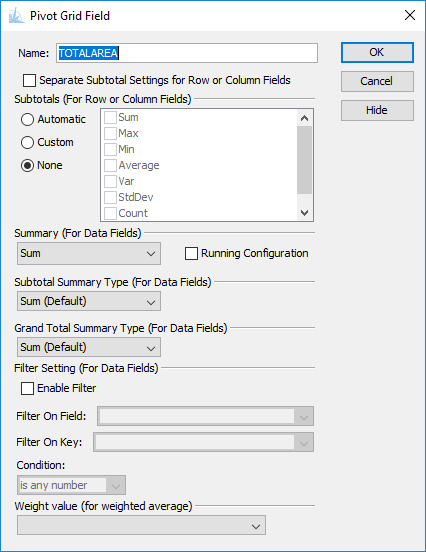
Many additional options (sort order, summary statistic type, subtotaling mode)
may be accessed by right-clicking on the field names.
Several options are available to save and export the contents of a pivot table. The File menu contains actions to save the contents of the pivot table as an Excel workbook, a PDF document, or an HTML table.
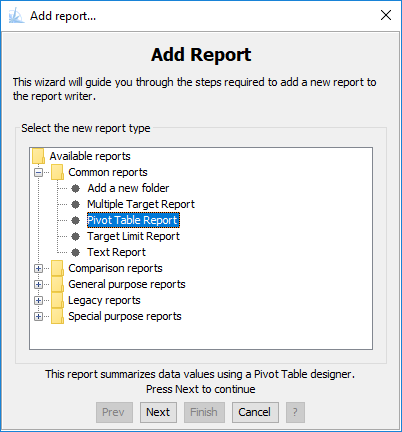
The ReportWriter also has a pivot table report template. This can be used to make a report definition that can be saved in to a script and reloaded every time Patchworks restarts. Simply use the "Add report" wizard to configure the report, and save the resulting code in to a script.
Pivot table calculations are complex and can be time consuming. For this reason the scheduler will be paused when any pivot table window is visible. Pausing the scheduler ensures a consistent view of the data structures as the data cube is computed, and that the pivot table view accurately reflects the existing model values. A warning message will be displayed when a pivot table is being opened on a data table that is based on internal model data.