Customizing aspatial netdowns with the TableDesigner
Aspatial netdowns are used when there are landbase reductions that are too small to map, or where a reduction factor is being used instead of doing the mapping. The ForestModel language has the <netdown> element for describing netdowns by a fixed proportion. This note will describe a simple and convenient way to set a custom reduction on each polygon using the new TableDesigner tool.
Suppose that we have a shapefile containing a forest inventory. The records describe the forest conditions and has two columns (nha and rha) describing the net harvest area and reserved forest area in each polygon.
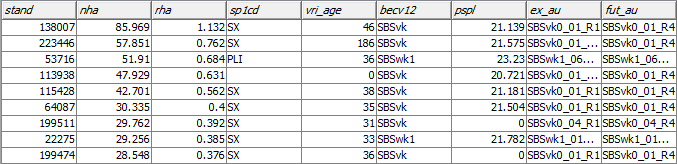
Although this information is complete it is not in a format that is easily used by the MatrixBuilder tool. As you may recall, the MatrixBuilder processes one record at a time, with each record being classified as either managed or unmanaged. We need to split each of these records in to two, one for the managed component, and one for the unmanaged. The ForestModel <netdown> will do this for us, but only using a fixed proportion for each stratification group. The rules within the MatrixBuilder can only operate on fields that have been assigned as stratification variables. In cases where the proportion varies with each record we would have to stratify on the percent reduction values, perhaps resulting in unique tracks for each input record (if the percentage reduction was highly varied). Having a unique set of tracks for each input record would result in a bulky input matrix that may unnecessarily slow down the model.
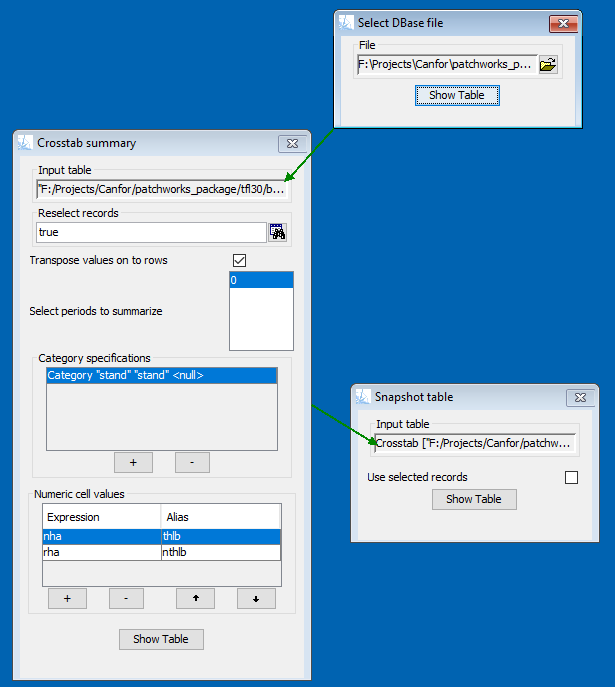
There is a convenient work around for this problem, which is to preprocess the input file to split the records into managed and unmanaged parts prior to input in to the MatrixBuilder. We can do this 'on-the-fly' using a CrossTab table. Here is a recipe that will summarize the available and reserved area in each record, resulting in two output records for each input record. Splitting the records ahead of time will avoid the need to stratify within the MatrixBuilder on the percent reduction factor, and will generate fewer tracks and a more compact input matrix. Here is the control used to create the crosstab:
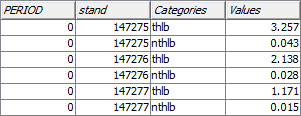
The resulting crosstab table appears as follows:
And here is the constructor for this table.
parent2 = AttributeStore.openOrReuse("sub_resultant.dbf");
periods3 = new int[] {0};

store = new CrosstabStore(parent2, // parent
    "true", // reselectExpression
    periods3, // periods
    true // transpose
);
store.addCategory("stand", "stand", null);
store.addValue("thlb", "nha");
store.addValue("nthlb", "rha");
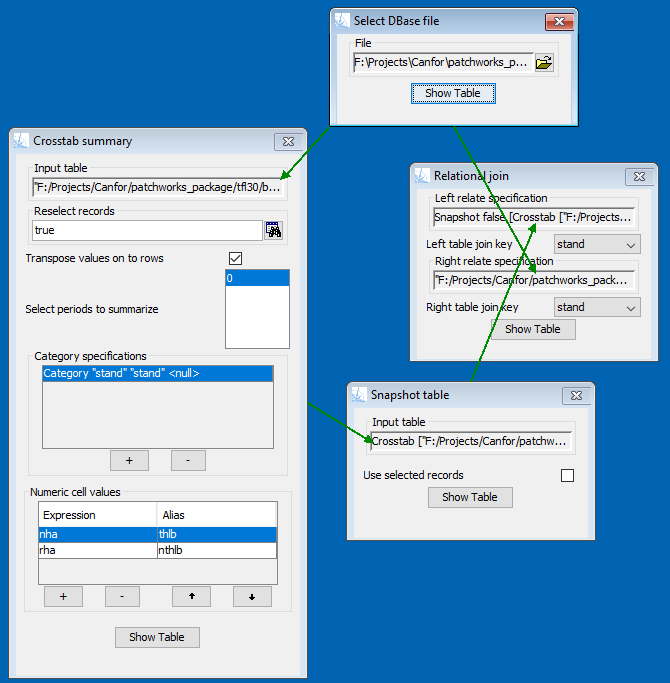
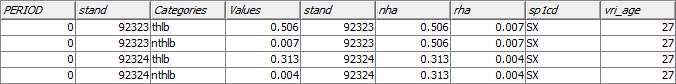
Of course the MatrixBuilder will require additional columns from the original inventory, and we can use a relational join operator to add all of the remaining columns. We can use the output from the crosstab as the base relation, and join additional column by the stand key. Here is the TableDesigner view for this join:
The output table from this join appears as follows:
And here is the resulting constructor for this table.
parent4 = AttributeStore.openOrReuse("sub_resultant.dbf");
periods5 = new int[] {0};

crosstab3 = new CrosstabStore(parent4, // parent
    "true", // reselectExpression
    periods5, // periods
    true // transpose
);
crosstab3.setShortName("Table4");
crosstab3.addCategory("stand", "stand", null);
crosstab3.addValue("thlb", "nha");
crosstab3.addValue("nthlb", "rha");
table2 = crosstab3.getSnapshot(false);
table2.setShortName("Table4");
table6 = AttributeStore.openOrReuse("sub_resultant.dbf");
store = table2.addRelate(table6, "PERIOD", "stand");
The TableDesigner can be used interactively from within the MatrixBuilder application to design and encode the table structure. The TableDesigner will return a concise TableSpec string that contains all of the information contained in the constructor.
Relate [Snapshot false [Crosstab [sub_resultant.dbf] true true <new int[] {0}> [Category stand stand null] [Values Values <new String[] {"nha", "rha"}> <new String[] {"thlb", "nthlb"}>]]] PERIOD [sub_resultant.dbf] stand
The TableSpec definition works well with the Patchworks tools, automatically opening the required tables and forming the correct structures. Here is the wquivalent TableSpec scripting command to the above constructor:
store = TableSpec.open("""
Relate [Snapshot false [Crosstab [sub_resultant.dbf] true true <new int[] {0}> [Category stand stand null] [Values Values <new String[] {"nha", "rha"}> <new String[] {"thlb", "nthlb"}>]]] PERIOD [sub_resultant.dbf] stand
""");
The final step in the process is defining how the ForestModel will work with this reformulated input. This part is easy:
- The name of the area field is "Values".
- Stand records having a "Categories" value of "thlb" are managed, and records with a "Categories" value of "nthlb" are unmanaged.
The TableDesigner is an easy to use graphical tool that provides access to all of the Patchworks system table structures. Many other variations of this basic technique can be used to rearrange data for use by the MatrixBuilder or other tools. A lot of normally tedious work can often be performed with a few simple clicks. Once the design has been drawn out and tested, it is easy to convert to a script for reliable reuse. Give the TableDesigner a try and see how it can help with your routine data processing workflows.