Raster data display
Raster technology provides a simple and powerful way to model spatial relationships across and between surfaces. Some operations that are slow and problematic with vector methods run efficiently in raster mode, and raster modeling is often the method of choice for habitat modelers. Patchworks has a capability to work with raster data sets and provides some great tools for viewing, printing and summarizing raster data sets.
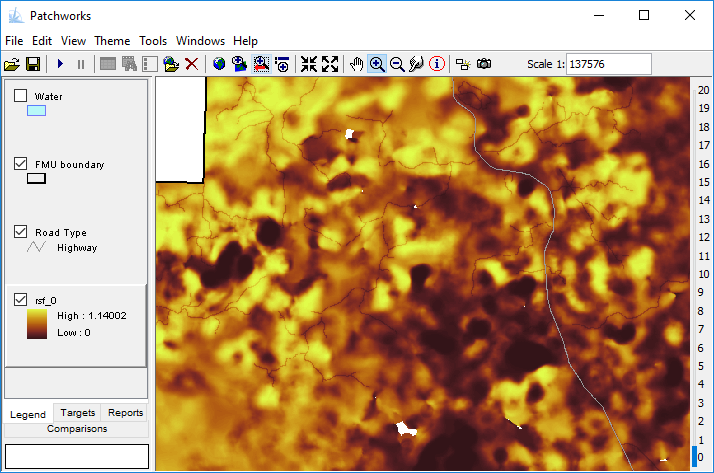
At the present the Patchworks map viewer can display ESRI binary grid format data sets. Although this is an older format, it provides very high ratio lossless compression and has efficient processing characteristics. To view a grid file in the Patchworks map viewer simply drag the folder containing the grid file on to the map viewer. The grid will be displayed using default symbology.
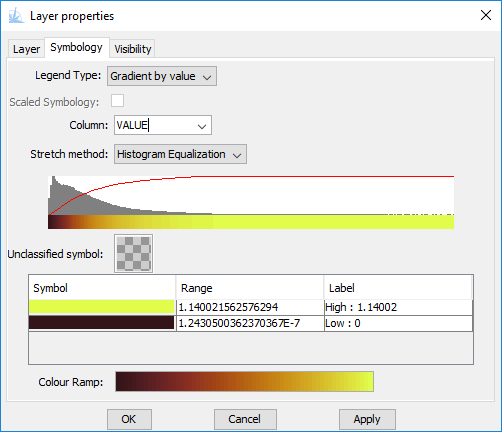
The Patchworks map symbology customizer provides a range of color ramps and value stretch methods that are quick and easy to try out and apply.
Grid files that have been built with a VAT (value attribute table) will have an associated table that can be opened in the table viewer. Other related lookup tables can be joined to the attribute table, allowing access to an extended set of attributes.
Grid layers can be used just like vector layers in the map viewer and in map reports. Grid files with a VAT can also be used with any of the standard report templates. And just like the rest of the Patchworks system, the code generation tools can be used to produce scripts that can be used to customize your modeling project.