Importing yield data from external models
Growth and yield data are a essential input to Patchworks: without these data wood supply analysis simply could not be done. Yield curves often come from complex external models (FVS, MIST, VDYP or GYPSY for example) and differing output formats raise compatibility issues. This note describes an easy and flexible way to import a variety of yield curve data formats in to the Patchworks model.
The types of calculations required to develop yield curves are usually far too complicated to represent using Patchworks curve expressions. Specialized growth and yield models are most often used for this task. These models accept parameters and coefficients describing stand conditions as inputs, and output tables of numbers that describe the development and change in stand characteristics such as diameter, height, stand density, basal area, wood volumes and biomass.
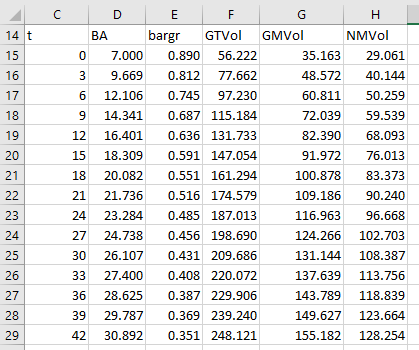
It is very common for these models to generate their outputs in a tabular format, such as the following example that is taken from an Excel spreadsheet. In this example row 14 contains the column headings, column C contains the ages at which the model has generated the estimates and the other columns contains the respective predictions (basal area, gross total volume, gross merchantable volume, net merchantable volume).
Stand dynamics, including yield curves, are expressed in Patchworks using the ForestModel XML language. The <curvetable> element is the container for tables of yield curve data. In many cases output data from a growth and yield model can be copied and pasted into a curvetable container with only a few parameters to guide the interpretation. The <curvetable> example below shows just this.
<curvetable split="\t" pattern="PRF.hdsel_hdsl2.Ba22.%h">
  t	BA	bargr	GTVol	GMVol	NMVol
  0	7.000	0.890	56.222	35.163	29.061
  3	9.669	0.812	77.662	48.572	40.144
  6	12.106	0.745	97.230	60.811	50.259
  9	14.341	0.687	115.184	72.039	59.539
  12	16.401	0.636	131.733	82.390	68.093
  15	18.309	0.591	147.054	91.972	76.013
  18	20.082	0.551	161.294	100.878	83.373
  21	21.736	0.516	174.579	109.186	90.240
  24	23.284	0.485	187.013	116.963	96.668
  27	24.738	0.456	198.690	124.266	102.703
  30	26.107	0.431	209.686	131.144	108.387
  33	27.400	0.408	220.072	137.639	113.756
  36	28.625	0.387	229.906	143.789	118.839
  39	29.787	0.369	239.240	149.627	123.664
  42	30.892	0.351	248.121	155.182	128.254
  ... lines omitted for brevity
</curvetable>
The data has been copied from the spreadsheet and pasted in to the ForestModel file without any changes. Excel has separated the values in to columns using tab characters, which is why the columns appear to line up. This data has been wrapped with a <curvetable> element. In this example the <curvetable> tag has two parameters. The first attribute (split="\t") indicates that that the table is to be split in to columns at tab characters (\t is an indicator for the tab character). By default the first column is assumed to contain the age column (although this can be overridden by an attribute). The second attribute (pattern="PRF.hdsel_hdsl2.Ba22.%h") provides a template for creating curve id labels. Each of the column headings from the first row of the data table are combined with the pattern. The column heading is substituted for the "%h" token, and the result is the curve id label. These curves are added to the curve library, and may be referenced elsewhere in the ForestModel by these labels.
The next example shows data copied unchanged from a Woodstock yld file. This data may have come from a growth and yield model and have been arranged in to Woodstock format. The leftmost column again represents age, and as this matches the default assumption nothing additional needs to be specified. Woodstock format separates data in to columns using one or more space characters, and this is indicated with the split="\s+" attribute (one or more whitespace characters). The initial age value is 5, so the curves do not start at the origin. The forcezero="0" attribute will inject a vertice of (0,0) in to the start of each curve so that each curve will intercept the origin. The missing attribute specifies that data values of "-" will be considered to be missing, so the value for that row will be ignored. The pattern template includes the theme information as well as the yield curve column heading.
<curvetable split="\s+" forcezero="0" missing="-" pattern="?,?,5303000,?,?,?,?,GROW,EX,?,?,?,?,?,?:%h">
  _AGE   Ytpa     Yba    Yqmd  yAG  yBG   Ybole  Ytotal     Yce     Ydf     Yww     Yoc     Ypn  Yobtprep
  5       - 1.00000 0.70000  0.00000  0.00000 0.00000 0.00000 0.00000 0.00000 0.00000 0.00000 0.00000  10.00000
  10       - 2.00000 1.30000  0.00000  0.00000 0.00000 0.00000 0.00000 0.00000 0.00000 0.00000 0.00000  10.00000
  15       - 7.00000 3.00000  0.00000  0.00000 0.00000 0.00000 0.00000 0.00000 0.00000 0.00000 0.00000  10.00000
  20 122.500 26.0000 5.70000  5.60000  1.60000 3.40000 0.00000 0.00000 0.00000 0.00000 0.00000 0.00000  10.00000
  25 122.400 46.0000 7.60000 12.40000  3.40000 7.40000 0.00000 0.00000 0.00000 0.00000 0.00000 0.00000  10.00000
  30 122.300 69.0000 9.40000 23.50000  6.10000 14.6000 0.00000 0.00000 0.00000 0.00000 0.00000 0.00000  10.00000
  35 122.200 96.0000 11.1000 40.30000 10.10000 26.3000 0.00000 0.00000 0.00000 0.00000 0.00000 0.00000  10.00000
  40 122.200 125.000 12.7000 62.20000 15.10000 41.9000 7.33000 0.00000 0.00000 0.00000 0.00000 4.89000   2.23123
  45 119.800 148.000 15.0000 86.40000 20.50000 59.5000 13.1800 0.00000 0.00000 0.00000 0.00000 11.9800   1.73075
  50 111.200 163.000 16.4000 105.2000 24.60000 73.8000 15.5600 0.00000 0.00000 0.00000 0.00000 13.3400   1.62501
  55 100.300 170.000 17.6000 118.1000 27.40000 84.1000 19.0500 0.00000 0.00000 0.00000 0.00000 16.0400   1.53312
  60 88.1000 170.000 18.8000 124.3000 28.70000 89.6000 19.3700 0.00000 0.00000 0.00000 0.00000 18.4900   1.50468
  65 78.5000 170.000 19.9000 130.0000 29.90000 94.7000 21.9900 0.00000 0.00000 0.00000 0.00000 20.4200   1.45521
  70 71.0000 170.000 20.9000 135.3000 31.00000 99.4000 24.1500 0.00000 0.00000 0.00000 0.00000 22.7300   1.42015
  75 64.7000 170.000 21.9000 140.1000 32.10000 103.800 25.2300 0.00000 0.00000 0.00000 0.00000 23.2900   1.39817
  80 58.7000 170.000 23.0000 144.6000 33.00000 108.000 26.9900 0.00000 0.00000 0.00000 0.00000 26.9900   1.37284
  85 54.0000 169.000 24.0000 148.7000 33.90000 111.800 29.6800 0.00000 0.00000 0.00000 0.00000 29.1400   1.34700
  90 49.9000 169.000 24.9000 152.7000 34.70000 115.500 28.9500 0.00000 0.00000 0.00000 0.00000 27.9600   1.34119
  95 46.4000 169.000 25.9000 156.3000 35.50000 118.900 30.6400 0.00000 0.00000 0.00000 0.00000 29.7100   1.32431
  100 43.3000 169.000 26.8000 159.8000 36.20000 122.200 32.4400 0.00000 0.00000 0.00000 0.00000 31.1500   1.30853
  105 40.3000 169.000 27.7000 163.1000 36.90000 125.400 33.8900 0.00000 0.00000 0.00000 0.00000 32.6800   1.29542
  110 38.0000 169.000 28.6000 166.2000 37.50000 128.300 34.5400 0.00000 0.00000 0.00000 0.00000 34.5400   1.28682
  115 35.4000 169.000 29.6000 169.1000 38.20000 131.200 36.1200 0.00000 0.00000 0.00000 0.00000 35.7700   1.27460
</curvetable>
This final example below uses output from the FVS growth and yield model. The age value is in column 1 (agecolumn="1", numbering starts at column zero), and since this table is in CSV format the columns are separated by commas (split=","). This data table lists multiple sets of curve data, one for each unique StandID value. The pattern attribute includes a "%0c" token. This indicates that column 0 is will identify distinct curve sets, and the curve id value will include the StandID at the indicated position. The data table is read until the StandID value changes, the curves are processed and assigned unique curve id labels. The remaining part of the of the input data is processed in a similar way, breaking input rows in to curve sets at each change in the StandID value.
<curvetable agecolumn="1" split="," forcezero="0" pattern="?,?,%0c,?,?,?,?,GROW,EX,?,?,?,?,?,?:%h">
  StandID,Age,Tpa,BA,SDI,CCF,TopHt,QMD,TCuFt,MCuFt,BdFt
  6340008,77,773,274,424,182,100,8.07,9305,6971,19912
  6340008,82,499,242,360,144,101,9.43,8528,6520,20451
  6340008,87,451,243,358,140,103,9.95,8712,6833,21867
  6340008,92,402,244,354,136,105,10.55,8846,7016,23175
  6340008,97,362,245,351,131,106,11.13,8995,7180,24497
  6340008,102,329,245,347,128,109,11.68,9135,7358,25587
  6340008,107,296,246,343,123,111,12.33,9295,7575,26971
  6340008,112,269,246,339,120,113,12.95,9446,7757,28506
  6340008,117,228,142,205,76,103,10.70,5262,4269,16084
  6340008,122,303,150,215,79,105,9.54,5610,4572,17419
  6340008,127,300,160,227,84,107,9.88,5986,4875,18869
  6340008,132,297,170,241,88,108,10.24,6379,5226,20563
  6340008,137,294,180,255,92,110,10.60,6826,5573,22275
  6340008,142,291,191,269,96,111,10.97,7263,5915,24034
  6340008,147,288,201,282,100,113,11.32,7714,6284,25846
  6340008,152,286,213,297,104,115,11.69,8224,6716,27872
  6340008,157,277,223,309,106,116,12.14,8642,7035,30145
  6340008,162,265,231,319,108,117,12.66,9019,7372,31568
  6340008,167,235,157,229,82,105,11.06,5858,4537,19469
  6340008,172,311,169,246,87,107,9.98,6308,5016,21850
  6340008,177,308,182,265,92,108,10.41,6818,5402,23665
  6340008,182,305,196,285,98,110,10.86,7378,5915,26831
  6340008,187,299,210,303,102,112,11.36,7960,6538,29081
  6340009,81,572,277,398,157,120,9.41,10645,8678,33863
  6340009,86,524,163,253,107,103,7.56,5848,4664,18013
  6340009,91,597,176,272,114,105,7.35,6271,5015,19882
  ... lines omitted for brevity
</curvetable>
Because the StandID column is used as a stratification value to identify curve sets, it is not used to create a curve by itself. This example only uses a single column to distinguish curve sets, but of course multiple columns (analysis unit, silvicultural intensity, treatment regime, etc) could be used.
This type of format can include a large number of curves, with no need to do any massaging of data. This can be made even easier by keeping the FVS data in an external file and using an entity reference, as in the following:
This goes at the top....

<?xml version="1.0" encoding="ISO-8859-1"?>
<!DOCTYPE ForestModel PUBLIC "ForestModel" "http://spatial.ca/ForestModel.dtd" [
<!ENTITY fvsdata SYSTEM "fvsdata_run1.csv" >
]>

And this goes where the curves are defined...

<curvetable agecolumn="1" split="," forcezero="0" pattern="?,?,%0c,?,?,?,?,GROW,EX,?,?,?,?,?,?:%h">
&fvsdata;
</curvetable>
The nice thing about this method is that the data in the external file can change, and the ForestModel will pick the most recent version when the MatrixBuilder is run.
Manual copy and paste actions are prone to errors. Although the above examples mention copying and pasting yield curve data, most often ForestModel files are built using scripts or other automated tools. Regardless of how the files are built, the <curvetable> element greatly simplifies the process of loading external growth and yield data in to the Patchworks model. Other conversion and column renaming options are available and are explained in the ForestModel documentation.