Concise charts
Target charts are a key tool for viewing simulation performance. Models may contain hundreds of targets, making it difficult to get a good overview of what is happening. Recent updates to the target chart viewer make it easier to customize your view into the heart of the simulation.
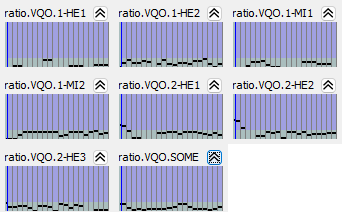
Target charts serve as both a view and a control. Each chart displays current account values and contains controls to set target values, weights, and other parameters. Individually, each chart packs a lot of information into a small window. However, when dozens of charts are presented on a screen, the visual clutter can be distracting. Target charts have just been updated with several new features to simplify the effective presentation of simulation values, making it easier to focus on what is important.
The first new feature is a concise display format. This format removes the decorations from around the chart and displays only the essential information. The chart is still active, showing target levels and account values, and you can still adjust target values using the mouse.
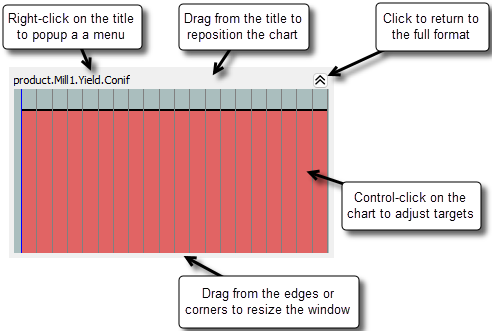
You can still resize the chart by dragging its edges wider or narrower, and reposition it by clicking and dragging on the title. Click the button in the upper right corner to return to the full format, which includes all options, or right-click on the title to display a pop-up menu with further options.
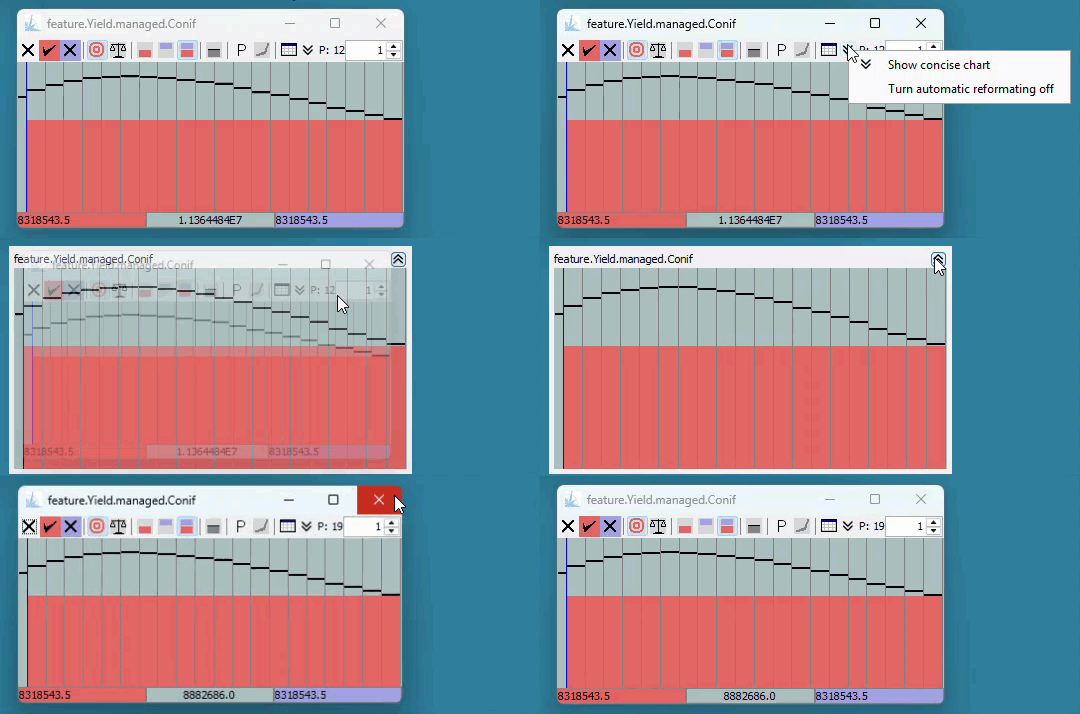
The concise format is activated in several ways: either automatically or manually. Automatic mode (the default) will engage concise mode when the width of the chart window is reduced below a size threshold where the layout appears crowded. If you resize the window wider than this threshold, the display will automatically return to full format.
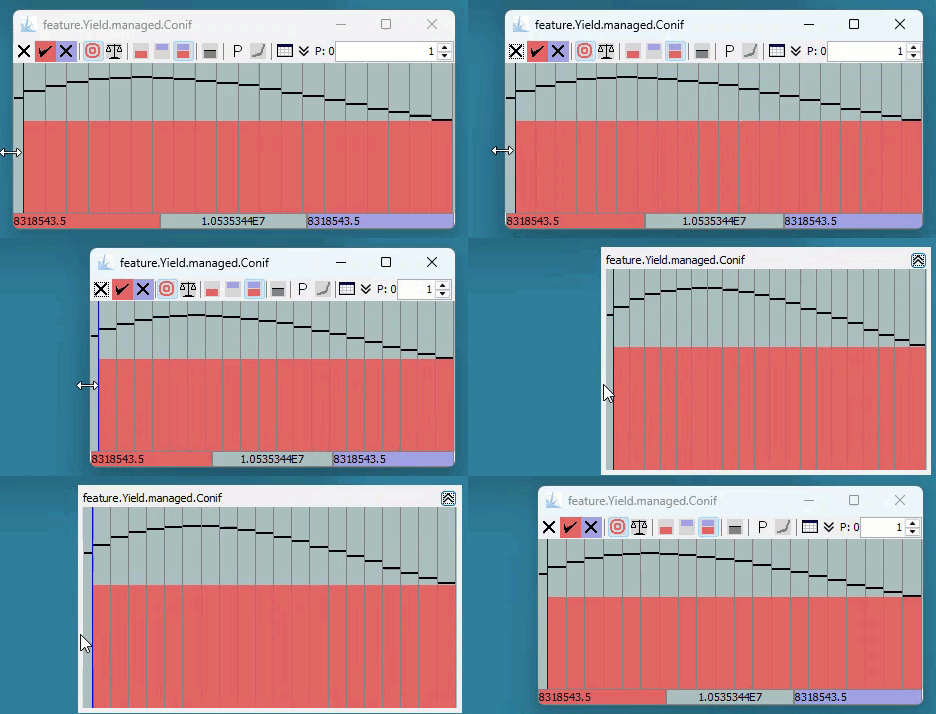
Automatic mode is controlled by a menu selection (from the "Adjust" button in full mode, or by right-clicking on the title while in concise format). If you turn automatic mode off, the format will not change when the window is resized, regardless of its width. In this case, you can manually switch between full and concise formats using the buttons in the toolbar.
The chart will remember the size settings for both full and concise formats, applying the previous sizes as you toggle between them.
Target chart windows are initialized in automatic mode. When you first open a target chart, the default size will be large enough to display in full mode. If you open a set of charts (by selecting a group of accounts in the Targets tab, then right-clicking and choosing the "Open all selected targets" menu item), the charts will be arranged in a cascade formation on the desktop. Click the "Tile all open and selected targets" option in the Targets tab to arrange the selected charts into a compact formation. The tile manager dialog will open, presenting an array of options for arranging the windows.
The top row of buttons in the tile manager dialog shows several alternate tiling geometries. These geometries represent ways the window can be divided into rectangular cells. Select a geometry with suitable gradations, and a larger version will appear in the central panel. In the central panel, click with the mouse on a grid cell where the tiling should start, and optionally control-click on a grid cell to extend the selection. Choose the monitor to receive the tiling (in case you have a multi-monitor workstation). At this point, you may click the "Show code" button to generate a script that will recreate the selected tiling options, or click the "OK" button to apply the tiling.
The windows will be resized and arranged in a grid formation. Depending on the number of charts selected and the tiling geometry, the target charts will automatically switch to full or concise format. If you have chosen a large number of charts and/or a small tiling destination, the charts will display in concise format.
In addition to the predefined tiling geometries, you may also select a tiling region by dragging the pointer. Do so by selecting the "finger pointing" icon from the top row of the tiling manager dialog. When you click this icon, the current screen will dim slightly. If you have multiple screens, click with the left mouse button to change the active screen. Press the escape button to cancel the interactive tiling selection. Otherwise, press the left mouse button and drag the pointer across a region of the display to select the tiling region. Releasing the mouse button will complete the selection and tile the windows.
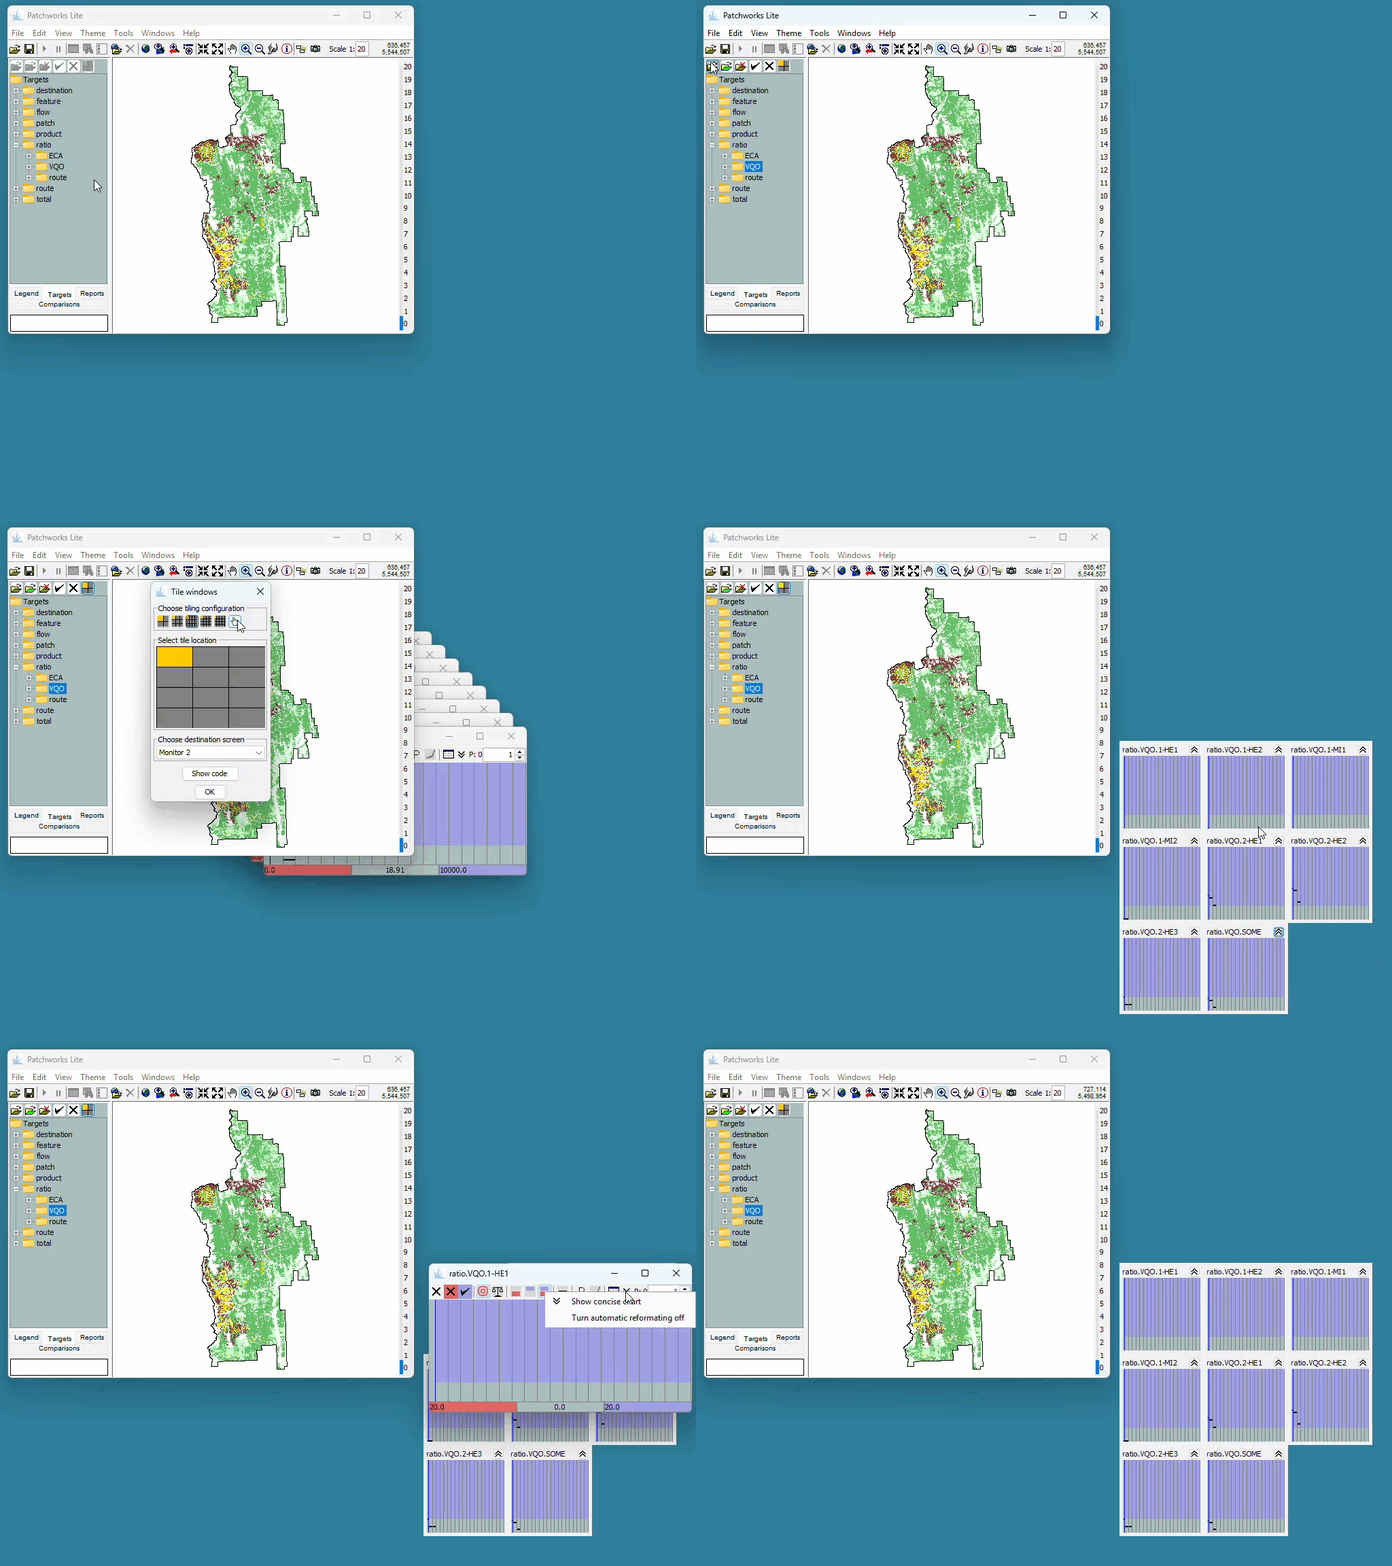
Click image to enlarge
Try this with a few groups of targets. Once you get the hang of it, you will find that interactive selection is a quick way to organize your most important indicators.
If you identify a set of important indicators that you always want to have opened in a particular arrangement, you can add an API call to the Patchworks_Init function. To do so, navigate to the Targets tab, select and open the targets of interest, and then open the tiling manager. Choose your preferred tiling geometry, and click the "Show code" button. This action will display the script code that performs the corresponding tiling action.
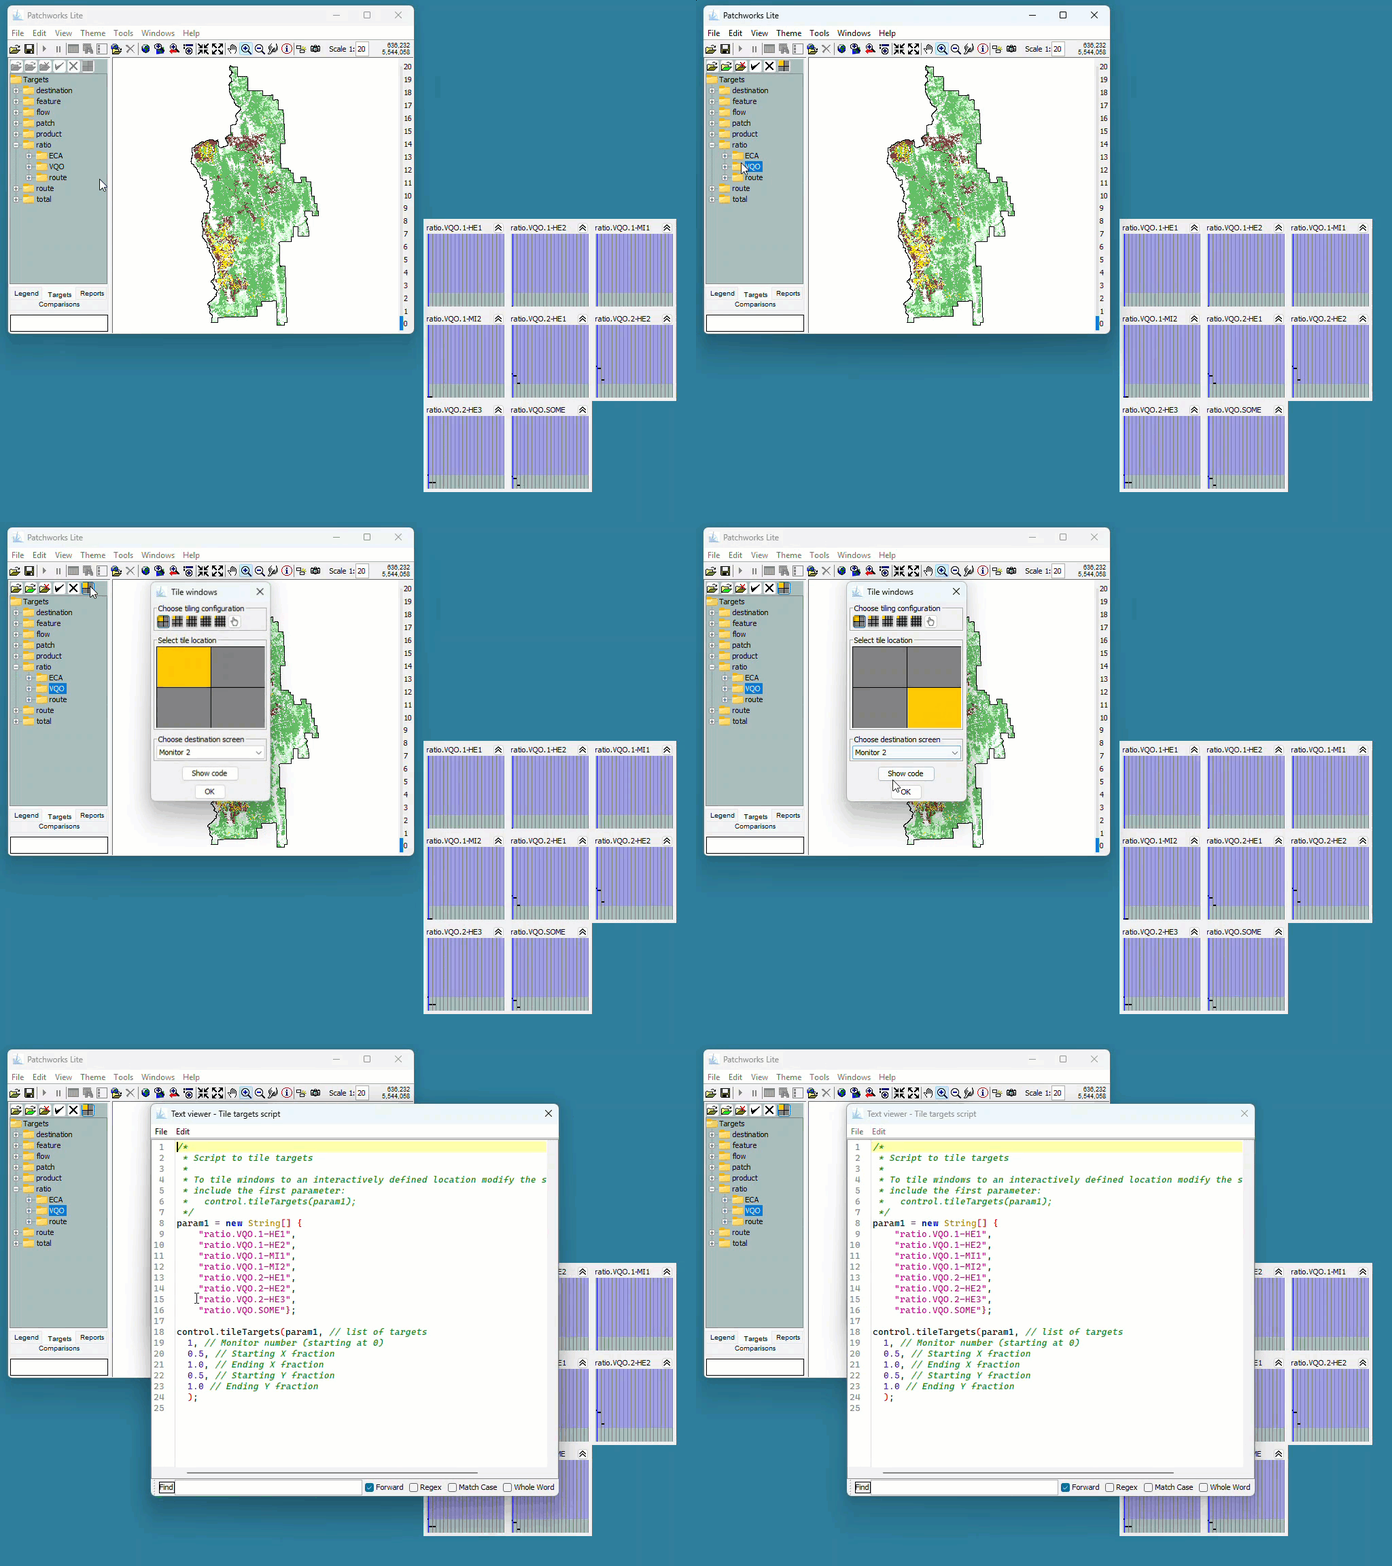
Click image to enlarge
The best practice would be to copy the resulting script code into a new file, perhaps named "myCustomTiles.bsh". This script could be invoked from within the Patchworks_Init function to automatically open and arrange the favourite windows, or it could be "dropped" onto the Patchworks viewer at any time to perform the tiling.