Color ramps
Color is an extremely important component of the visual presentation of map data: the choice of colors will affect viewers perception and comprehension of the message. Patchworks provides a very easy to use mechanism to review and apply a range of attractive color sets.
Patchworks includes a range of attractive and effective color sets, including the ColorBrewer2 set by Cynthia Brewer, and the cmocean set by Kristen M. Thyng. These color sets can be rapidly previewed and selected by a simple dropdown menu within the symbology configuration panel.
The color sets have been classified in to three categories:
- qualitative, best for categorical values
- sequential, best for ordered data that progress from low to high, and
- divergent, best for ordered data with an emphasis on the middle of the range and the extremes on both ends.
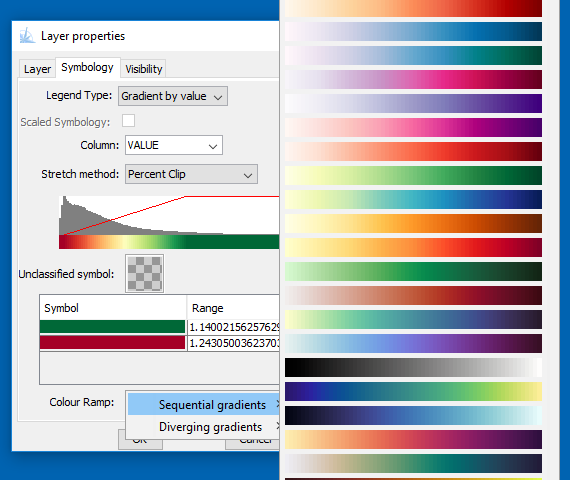
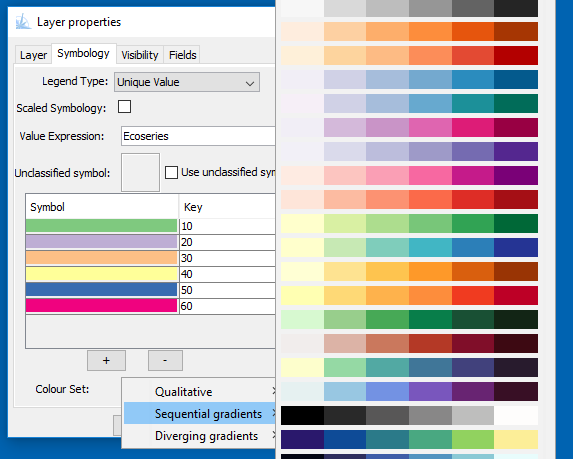
When applying a color set to continuous data (such as a gradient theme) the color set selector will show a continuous gradient ramp (as above). When applying a color set to discrete categories (such as a Unique Value theme, or a Numeric Range theme), the selector will intelligently quantitize the color ramp in to the appropriate number of categories, as show below.
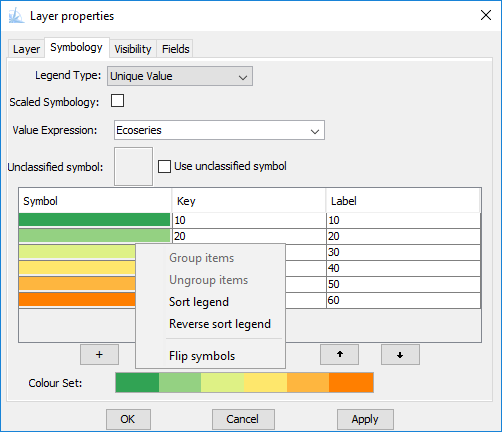
Further adjustments to quantitized color ramps can be made by right-clicking on one of the color symbols, as shown below. Sorting and flipping apply to all of the symbols. Grouping and ungrouping only apply to the selected symbols.
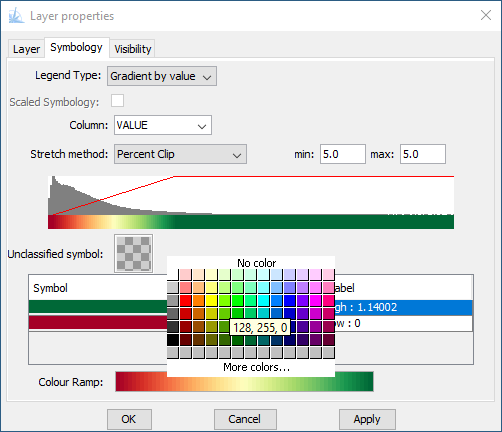
Continuous color ramps can be customized by changing the color value at either end of the ends of the ramp (double-click on the color sample). The interior of the ramp will be populated with a linear gradient between the end colors.